Debugging GeoNode Installations
There are several mechanisms to debug GeoNode installations, the most common ones are discussed in the following sections.
Viewing the logs
There are many kinds of logs in GeoNode, most of them are located in /var/log/geonode/ and will be explained below in order of relevance:
GeoNode main log: This is the output of the Django application generated by Apache, it may contain detailed information about uploads and high level problems.
The default location is
/var/log/geonode/apache.logor/var/log/apache2/error.log.It is set to a very low level (not very much information is logged) by default, but it’s output can be increased by setting the logging level toDEBUGin/etc/geonode/local_settings.py.
GeoServer log: It contains most of the information related to problems with data, rendering and styling errors.
This one can be accessed at
GEOSERVER_DATA_DIR/logs/geoserver.log, which is usually/var/lib/tomcat7/webapps/geoserver/data/logs/geoserver.logor/var/lib/geoserver/geonode-data/logs/geoserver.log.It may also be symlinked in
/var/log/geonode/geoserver.log.Tomcat logs: Tomcat logs could indicate problems loading GeoServer.
They can be found at
/var/lib/tomcat7/logs/catalina.outor/var/lib/tomcat/geoserver/logs/catalina.out.PostgreSQL logs: PostgreSQL is accessed by GeoServer and Django, therefore information about errors which are very hard to debug may be found by looking at PostgreSQL’s logs.
They are located at
/var/log/postgresql/postgresql-$(psql_version)-main.logwhere $(psql_version) depends on your local installation.
Enabling DEBUG mode
Django can be set to return nicely formatted exceptions which are useful for debugging instead of generic 500 errors.
This is enabled by setting DEBUG=True in /home/geonode/geonode/geonode/local_settings.py (or /etc/geonode/local_settings.py if GeoNode has been installed using apt-get).
After enabling DEBUG, the Apache server has to be restarted for the changes to be picked up. In Ubuntu:
service apache2 restart
Other tips and tricks
Modifying GeoServer’s output strategy
Up to version 1.1, GeoNode used by default the SPEED output strategy of GeoServer, this meant that proper error messages were being sacrificed for performance.
Unfortunately, this caused many errors to be masked as XML parsing errors when layers were not properly configured.
It is recommended to verify the output strategy is set at least to PARTIAL_BUFFER2 (or a safer one, e.g. ``FILE``) with a high value for the buffer size.
More information about the different strategies and the performance vs correctness trade off is available at GeoServer’s web.xml file.
The typical location of the file that needs to be modified is /var/lib/tomcat7/webapps/geoserver/WEB-INF/web.xml as shown below:
<context-param>
  <param-name>serviceStrategy</param-name>
  <param-value>FILE</param-value>
</context-param>
Add the Django debug toolbar
Warning
The Debug Toolbar module must be disabled whe running the server in production (with Apache2 HTTPD Server WSGI)
The django debug toolbar offers a lot of information on about how the page you are seeing is created and used. From the database hits to the views involved. It is a configurable set of panels that display various debug information about the current request/response and when clicked, display more details about the panel’s content.
To install it:
$ pip install django-debug-toolbar
Then edit your settings
/home/geonode/geonode/geonode/settings.py(or/etc/geonode/settings.pyif GeoNode has been installed using apt-get) and add the following to the bottom of the file:#debug_toolbar settings if DEBUG: INTERNAL_IPS = ('127.0.0.1',) MIDDLEWARE_CLASSES += ( 'debug_toolbar.middleware.DebugToolbarMiddleware', ) INSTALLED_APPS += ( 'debug_toolbar', ) DEBUG_TOOLBAR_PANELS = [ 'debug_toolbar.panels.versions.VersionsPanel', 'debug_toolbar.panels.timer.TimerPanel', 'debug_toolbar.panels.settings.SettingsPanel', 'debug_toolbar.panels.headers.HeadersPanel', 'debug_toolbar.panels.request.RequestPanel', 'debug_toolbar.panels.sql.SQLPanel', 'debug_toolbar.panels.staticfiles.StaticFilesPanel', 'debug_toolbar.panels.templates.TemplatesPanel', 'debug_toolbar.panels.cache.CachePanel', 'debug_toolbar.panels.signals.SignalsPanel', 'debug_toolbar.panels.logging.LoggingPanel', 'debug_toolbar.panels.redirects.RedirectsPanel', ] DEBUG_TOOLBAR_CONFIG = { 'INTERCEPT_REDIRECTS': False, }
Stop Apache and start the server in Development Mode:
$ service apache2 stop
$ python manage.py runserver
Redirect the browser to http://localhost:8000. You should be able to see the Debug Panel on the right of the screen.
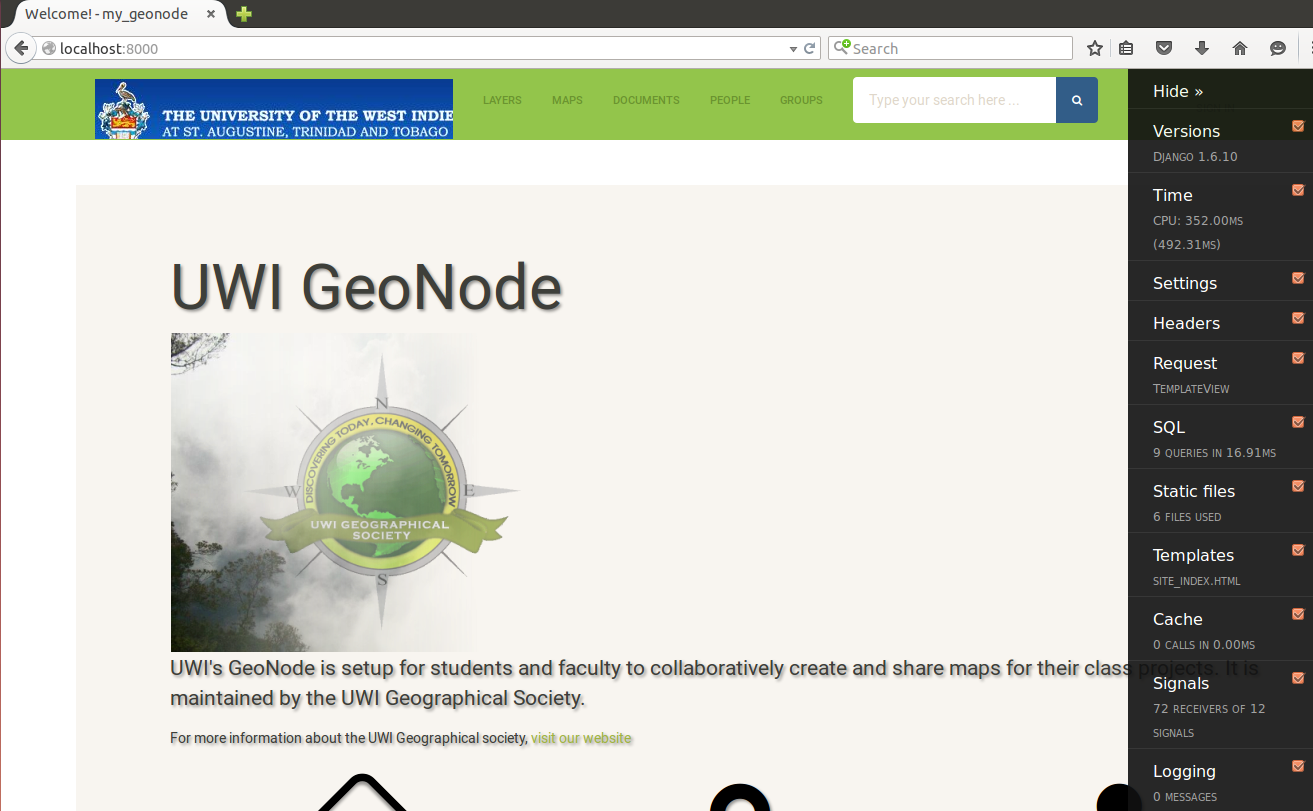
DJango Debug Toolbar Enabled In Devel Mode
- More:
For more set up and customize the panels read the official docs here